University team capstone · James Madison University · 2019–2021
Shell Eco-Marathon: from a vehicle model to the hardware
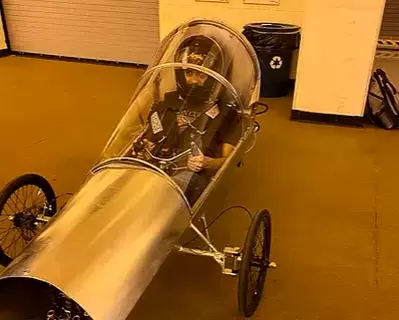
A two-year capstone on JMU's entry in the Shell Eco-Marathon, a student competition for the most fuel-efficient vehicle. For the first year I was on the strategy team, building a MATLAB/Simulink model of the car to inform how to drive it and how to design it. When COVID-19 ended the handoff from the senior team, the project grew to include the car itself, and my role moved to the mechanical drivetrain, from the engine to the wheels.
Project status: Two-year team capstone · 2019–2021
My part in a team project
- Strategy team member on a MATLAB/Simulink model of the vehicle, built to inform driving strategy and design decisions
- Owned one of the model's six evaluation criteria: the vehicle's structure and architecture as a model parameter
- After COVID-19 broadened the project: mechanical drivetrain design from the engine to the wheels
- Powertrain system and component work, with troubleshooting and testing of the drivetrain
- Worked across the chassis, engine, data-acquisition, and modeling teams
01The problem
A car with no strategy, and no way to analyze it
The team had a vehicle, but no way to predict how it would behave on the track, or which design changes would actually help.
JMU's engineering program ran its Shell Eco-Marathon entry as two teams. The senior team's job was to build a safe, drivable, fuel-efficient car for the 2020 competition and then hand it to the junior team, who would improve it for 2021. As juniors, our job was the strategy team's: build a mathematical model of the vehicle.
The model had two purposes. The first was to inform a driving strategy: speed, acceleration, braking, and where to turn around the course. The second was to give this team, and future JMU teams, a tool for design decisions: change a parameter, see what it does to the car's performance.
We started by defining the problem, after talking with the senior team and experts in software and automotive engineering: the team currently does not have a strategy to drive around the track, nor the platform to analyze the performance of the fuel-efficient vehicle.
The car's history made the point. At the 2019 competition, it didn't have enough power to climb an incline. The team pulled it off the track, tried several fixes, and never completed a run, so it went unranked. Nobody could say for sure why. The report listed two candidate causes: fuel delivery that couldn't keep up with a sudden change in demand, or road-load forces greater than the power the car could put down. Without a model, there was no good way to tell them apart.
- Competition
- Shell Eco-Marathon Americas, internal-combustion (ICE) class
- Measure
- Fuel efficiency, measured over trial runs on a closed course
- Course
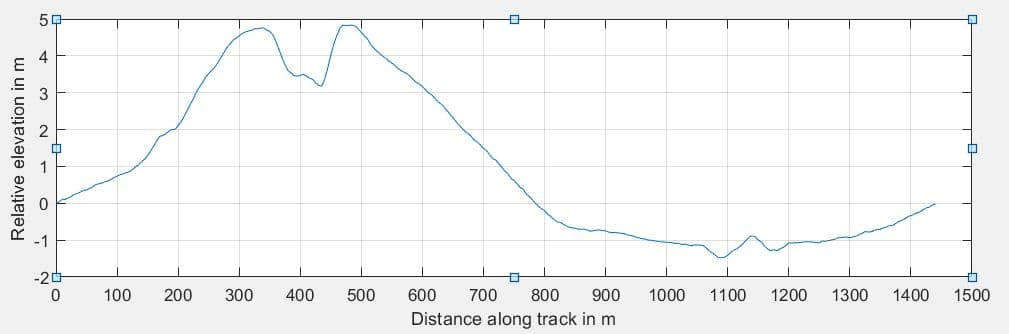
- Sonoma Raceway, California; a route of about 1,450 m (0.9 mi) planned for 2020
- Fuel
- Regular unleaded gasoline, 87 octane
- 2019 result
- The car lacked the power to climb an incline and didn't complete a run, so it went unranked
02Information gathering
Understand the car before modeling it
Before writing any equations, we gathered what the model would need: the car, the track, the data, and people who knew more than we did.
The most useful source was the senior team. Mentoring with them taught me the ins and outs of the design decisions on the car we were going to inherit. The strategy team split into three groups, each apprenticing with one of the senior subteams: drivetrain, chassis, and data acquisition.
For the track, I contacted Shell Eco-Marathon Americas for the course details. We also took the previous team's GPS data from the 2019 competition and converted it into elevation along the length of the track, so the model could account for every climb and descent. We also lined up two consultants: a JMU applied-mathematics professor and a specialist in the car's mechanical parts.
We also looked at what already existed. We planned to reuse the senior team's National Instruments USB-6210 data-acquisition device. Its limits were documented, and a measurement device that stays constant is one less variable when troubleshooting sensor readings; the sensors are the part that's easy to change.
- The senior team
- Mentoring on the car's design decisions, before the junior team inherited it
- The track
- Course details requested from Shell Eco-Marathon Americas; the previous team's GPS data, converted to elevation
- The car's history
- The 2019 team's own account of the incline failure
- Outside expertise
- An applied-mathematics professor and a specialist in the car's mechanical parts, as consultants
- Existing hardware
- The senior team's National Instruments USB-6210 data-acquisition device, reused rather than replaced
03Requirements
Requirements for a model, not a part
A model's requirements are about what it has to answer and how you'd know it's right.
Most of the project's requirement list came from Shell's 2020 rules: a roll bar that can take a 700 N static load, a fuel tank of 30, 100, or 250 cc, a clutch with a chain or belt guard, a sound limit of 90 dBA at 4 m. Those constrained the car. The requirements specific to our team constrained the model, and each one came with a way to verify it.
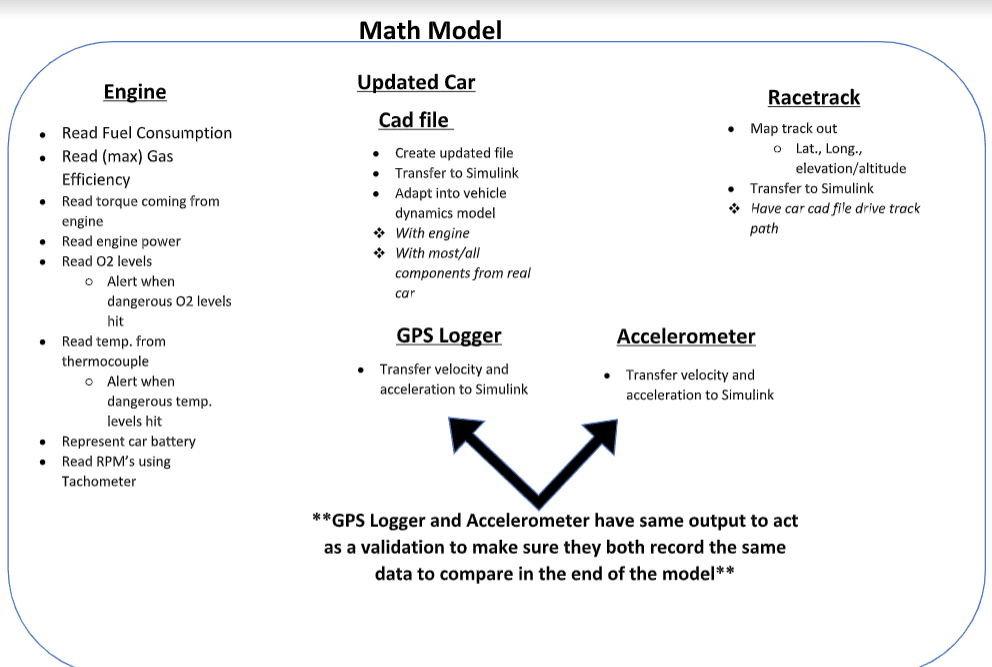
For concept evaluation, each of the six of us took one high-priority criterion. Mine was that the model must use the vehicle's structure and architecture as a parameter. That meant the car's dimensions, plus the main drivetrain and engine equations, so the model could calculate the power reaching the wheels and the aerodynamic drag. In other words, the physical design had to be an input you could change, not something baked into the code.
| The model must or should… | Source | How it would be verified |
|---|---|---|
| Inform and validate speed, acceleration, braking, and turning points around the track | Strategy team | A driving strategy, tailored to the course, that works once the model's outputs inform it |
| Inform and validate physical design decisions, such as chassis and drivetrain | Strategy team | Change a design variable and show the effect in the output |
| Use the vehicle's structure and architecture as a parameter | Teammate | Vehicle dimensions entered, with the main drivetrain and engine equations used to calculate power and aerodynamic drag |
| Include general inertia and frictional losses in the chassis and drivetrain | Drivetrain subteam | Model outputs follow the trends in sensor data from trial runs |
| Use the PowerTap hub as feedback on modeled power | Junior team | Modeled power curves line up with PowerTap curves |
| Take filtered, not raw, sensor data | Teammate | Sensor calibration curves created and checked with external test equipment |
| Be organized in labeled subroutines | Advisor; math consultant | Someone familiar with MATLAB can read it; each subteam's section is named and described |
04Concept selection
Choosing how to structure the model
We used the same concept-selection process you'd use for hardware, applied to the structure of a model.
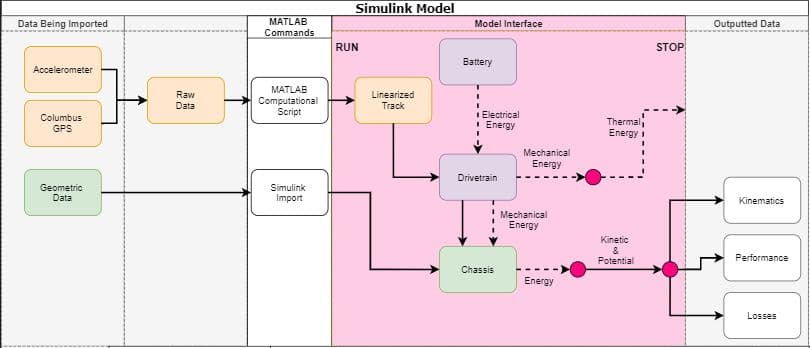
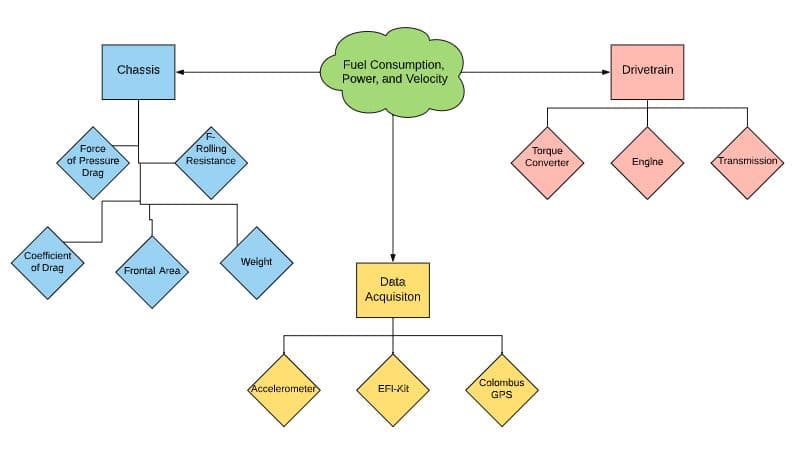
We started with a functional model in Simulink: what data comes in, how energy moves between the subsystems, and what comes out. Accelerometer and GPS data would run through a MATLAB script to a linearized track; the chassis geometry would come in from SolidWorks. Inside the model, the battery feeds the drivetrain, the drivetrain feeds the chassis, and the outputs are kinematics, performance, and losses.
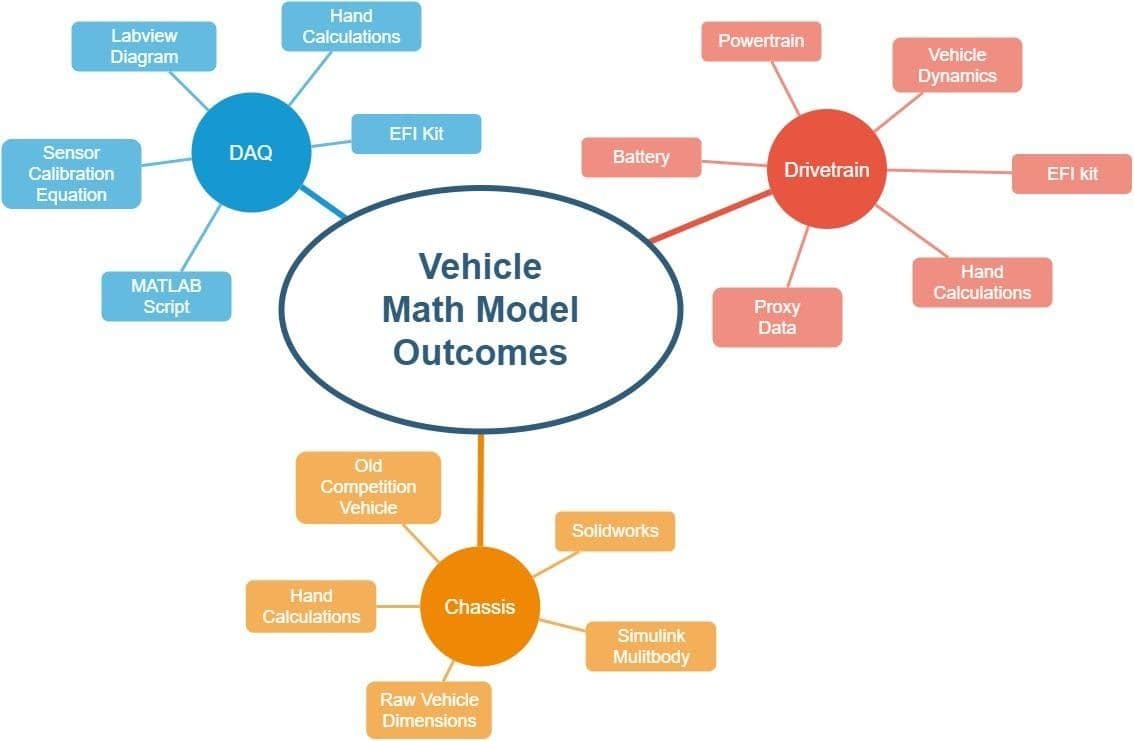
From there we generated concepts for how to structure the model itself, using concept sketches and concept maps, and narrowed them down in stages.
Generate
Concept sketches and concept maps for how the model should be structured, each traced to the functional model's energy flow.
Screen
A Go/No-Go check against one absolute requirement: the model must use the vehicle's structure and architecture as a parameter. Three concepts passed.
Score
Each of the six team members ran an Analytical Hierarchy Process on their own, weighting the criteria against each other before scoring the concepts.
Compare
Individual results were compared side by side, with each person's winning concept, average weight, and number of criteria. Two concepts came out ahead.
Merge
The selected structure, plus the clearer output layout of the other leading concept, with a slot added for the PowerTap rear hub.
05Modeling
What the model computes
The core is vehicle dynamics: the forces that cost fuel, worked out at each point on the track.
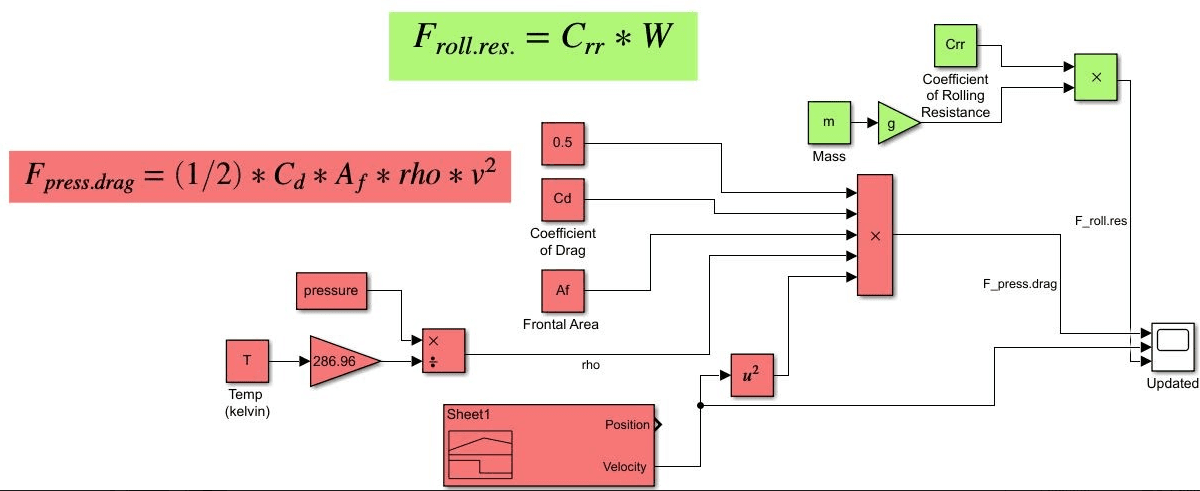
At a steady speed, a car is fighting road-load forces, and every one of them costs fuel. Those forces are also what the design can change: frontal area and body shape change drag, and wheel materials and tire pressure change rolling resistance. That's what made the model useful for design decisions as well as for strategy.
Data to drive the model would come from sensors on the car: a GPS logger and an accelerometer measuring the same velocity and acceleration, so each could check the other, plus a PowerTap rear hub to check the modeled power against measured power.
Forces acting on the car
- Rolling resistance
- Tires and wheels; changes with materials and tire pressure
- Gradient resistance
- The car's weight acting along the slope, from the elevation profile
- Aerodynamic drag
- Drag coefficient, frontal area, air density, and speed squared
- Inertia and friction
- Losses in the chassis and drivetrain
What comes out
- Kinematics
- Velocity and acceleration at points on the track
- Performance
- Power and fuel consumption (mpg)
- Losses
- Energy lost in the drivetrain and chassis
06Scope change
When the project changed
COVID-19 ended the handoff, and the junior team's scope grew to include the car itself.
COVID-19 ended the planned mentorship after spring break. The senior team was no longer available to finish the transition, leaving the junior team with a partly completed vehicle and a much larger scope than originally planned.
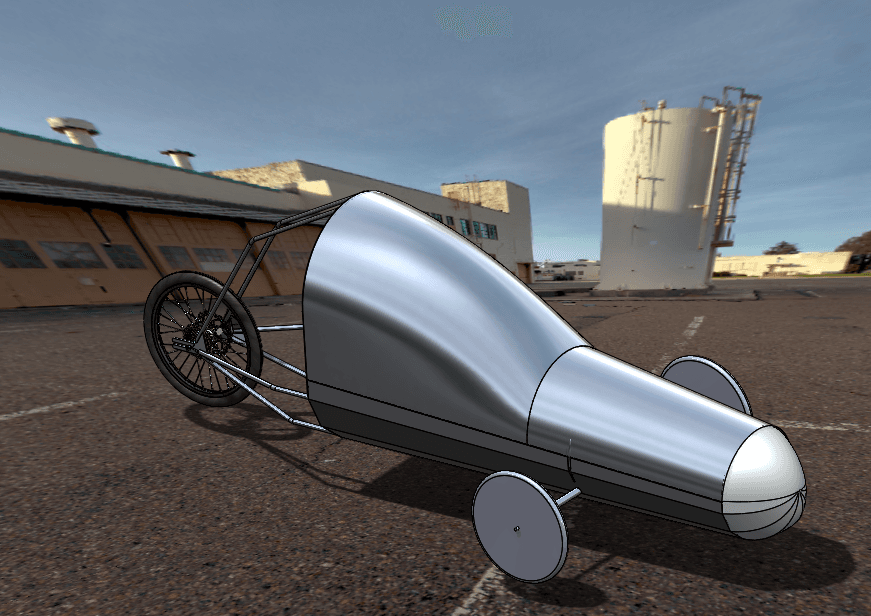
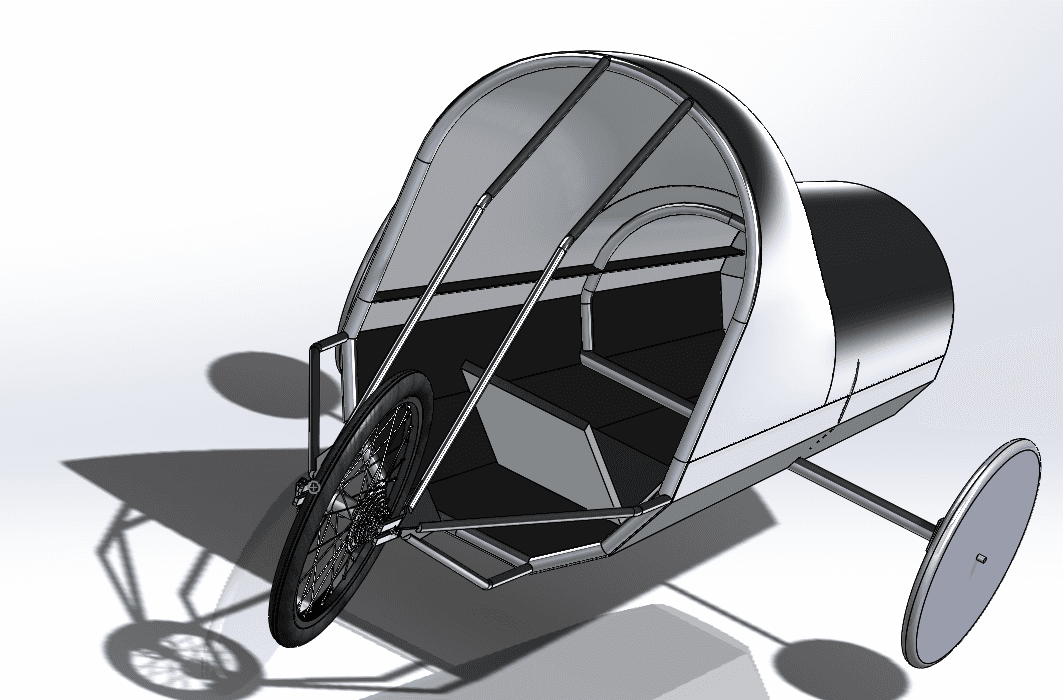
The project now covered designing and building the physical vehicle as well as the model.
07Drivetrain and powertrain
Engine to wheels
My role shifted with the project: from the model to the hardware between the engine and the wheels.
I took on mechanical drivetrain design from the engine to the wheels, worked on the powertrain system and its components, and spent time troubleshooting and testing the drivetrain. The project also included converting the engine from carburetion to a fuel-injected electromechanical system. An EFI kit already shows up in the model's concept maps from the first year, under both the drivetrain and data acquisition.
The drivetrain sits between the engine and the wheels and mounts to the chassis, so the work depended on the teammates responsible for chassis, engine, data acquisition, and the model. We briefed our faculty advisors on progress and took the harder problems to outside experts.
- Drivetrain
- Mechanical design from the engine to the wheels
- Powertrain
- The system and its components
- Engine
- Conversion from carburetion to a fuel-injected electromechanical system, as part of the project
- Troubleshooting
- The drivetrain and the engine
- Testing
- Components, subsystems, and the drivetrain assembly, tested continually
- Interfaces
- Worked with the teammates responsible for chassis, engine, data acquisition, and the model
08My role
My part in a team project
This was a six-person team with two faculty advisors. The model's design had its own owner, and the chassis, engine, and data-acquisition work had theirs. What I owned changed partway through the project.
What I did
- Requested the competition track details from Shell Eco-Marathon Americas in October 2019
- Took part in background research, requirements, and concept generation for the model
- Owned the evaluation criterion that became the Go/No-Go screen: the vehicle's structure and architecture as a model parameter
- Ran the concept-selection AHP individually, as each team member did
- After the scope change: mechanical drivetrain design from the engine to the wheels
- Powertrain work, drivetrain troubleshooting, and continual testing of components and assemblies
Owned by teammates or the whole team
- Overall design of the model, owned by the strategy team's architectural engineer
- The other five evaluation criteria, one per teammate
- Sensor selection, calibration, and filtering
- Chassis, engine, and data-acquisition work in the build phase
- Briefing faculty advisors on progress and taking hard problems to outside experts
09Lessons
What I learned
Define the problem first
We started in fall 2019 by writing a problem statement, with the seniors and outside experts, before designing anything. Without the right problem, the solution is useless.
Plan how a model will be checked
Validation was designed in from the start: GPS against accelerometer, modeled power against the PowerTap hub, outputs against trial-run trends.
Screen, then score
One absolute requirement cut the concepts down to three before anyone spent time weighting criteria.
Make ownership visible
Each evaluation criterion had one owner, and the requirements called for every subteam's section of the script to be named and described. On a six-person model, ownership has to be written down.
Plans change; the engineering doesn't
When the handoff fell apart, the scope grew to include the car itself. The process carried over; the problems got physical.
Paper and hardware are different jobs
Modeling a vehicle and getting its engine and drivetrain to work are related, but the second one doesn't let you assume anything away.
This project is a different kind of engineering from my human-centered work: less about one user, more about a vehicle as a system. It meant modeling energy through a whole vehicle, setting up requirements for analysis rather than for a part, and then working on the hardware where those subsystems actually meet.